
It’s More Than Just the Multiples!
Recently, the IBBA and M&A Source published their Q3 2019 Market Pulse Report, which gives an excellent synopsized take on the state of the recent market.
The Q3 2019 survey was conducted from October 1-15, 2019 and was completed by 236 business brokers and M&A advisors covering 210 transactions.
Valuation Multiples!
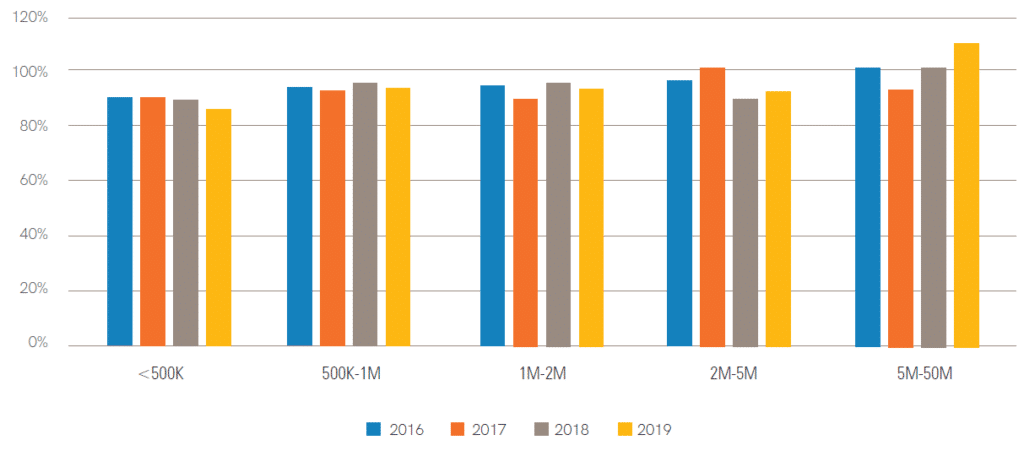
Let’s start with what everyone wants to know: the multiples! Highlighted in yellow are reported Q3 2019 multiples by the size of the transaction. The chart then shows the same multiples in past years dating back to 2014 for comparative purposes.
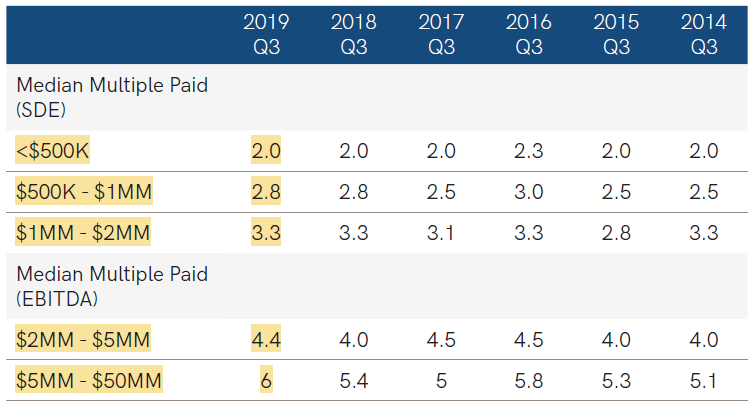
It’s important to explain what we are looking at because there is perennially a lot of confusion in the market over what the multiples are based on. For transactions valued up to $2MM, the multiple shown is the median multiple paid on Sellers Discretionary Earnings (SDE). What this means is that the analyst starts with net income and then adds back interest, depreciation, amortization, taxes (any income taxes paid through the P&L, not FICA), owner perks and benefits, and the total W2 wages of the owner. Or, if there is more than one owner, all owners’ W2 wages may be added back but the analyst should back out reasonable salaries for replacement staff except for one owner.
As an illustrative example, let’s take a hypothetical flower shop and do a quick valuation analysis:
| Net Income | $20,000 |
| Add Backs: | |
| Interest | $5,000 |
| Taxes | $0 |
| Depreciation | $4,000 |
| Amortization | $250 |
| Seller Perks | $1,000 |
| Seller Benefits | $12,000 |
| Seller W2 Wages | $45,000 |
| Seller’s Discretionary Earnings | $87,250 |
| Multiple from Chart | 2 |
| Estimated Business Value | $174,500 |
Personally, I do not care for straight SDE as a valuation metric because it does not offer insight into the cash flow left for debt service after the owner’s role is replaced by either a new buyer or a manager. Using the example above, what if the owner (making $45K/year) works 80 hours/week, handles all customer orders, setup and delivery? Conversely, what if the owner lives in another state, checks in twice a week with a competent manager and only handles periodic larger decisions involving hiring or insurance? These are two starkly different situations that a buyer would be entering and it would be understandable that a buyer and lender would view valuation and deal structure differently.
The data shows that for transactions above $2MM in valuation, the metric converts to EBITDA. Why is this? There can be various reasons but ultimately, in my opinion, it is because many small companies often do not have much left after the owner is paid a fair market salary. This is why the multiples are often so low as well.
Regardless of whether SDE or EBITDA is the “correct” metric, buyers and lenders are going to make assumptions about the amount of salary that a replacement owner or manager is going to drain from the company post-sale. We refer to the net result of this salary adjustment as “Adjusted EBITDA” and believe that it drives valuation more than straight EBITDA or SDE, particularly for companies <$5MM.
For example, let’s run a quick analysis on a hypothetical CNC machining company to show why:
| Net Income | $100,000 |
| Add Backs: | |
| Interest | $15,000 |
| Taxes | $0 |
| Depreciation | $150,000 |
| Amortization | $5,000 |
| Seller Perks | $15,000 |
| Seller Benefits | $20,000 |
| Seller W2 Wages | $175,000 |
| Seller’s Discretionary Earnings | $480,000 |
| Less: Replacement Manager | -$100,000 |
| Adjusted EBITDA | $380,000 |
| Multiple from Chart | 3.3 |
| Estimated Business Value | $1,254,000 |
In this instance, it wouldn’t be appropriate to use straight EBITDA or SDE because the owner has a hefty salary, perks, and benefits to consider. Any lender is going to take into consideration the necessary cost of replacing the owner’s function. I believe that when the IBBA reports EBITDA they do not mean straight EBITDA, but more of an “Adjusted EBITDA” that normalizes the wages required to replace an owner’s function.
A major takeaway from the data is that, while multiples have remained fairly consistent for companies valued under <$5MM, we continue to see prices climb for companies valued at $5-50MM. This is largely because lots of money is fighting over a relatively small pool of quality companies in this space.
Before we move to deal structure, I want to highlight a very important point taken from this quarter’s report and why handling valuation is so critical for wealth managers, CPAs, accountants, business appraisers, and business brokers alike: unrealistic expectations remains the leading reason that businesses do not sell. Check this out:
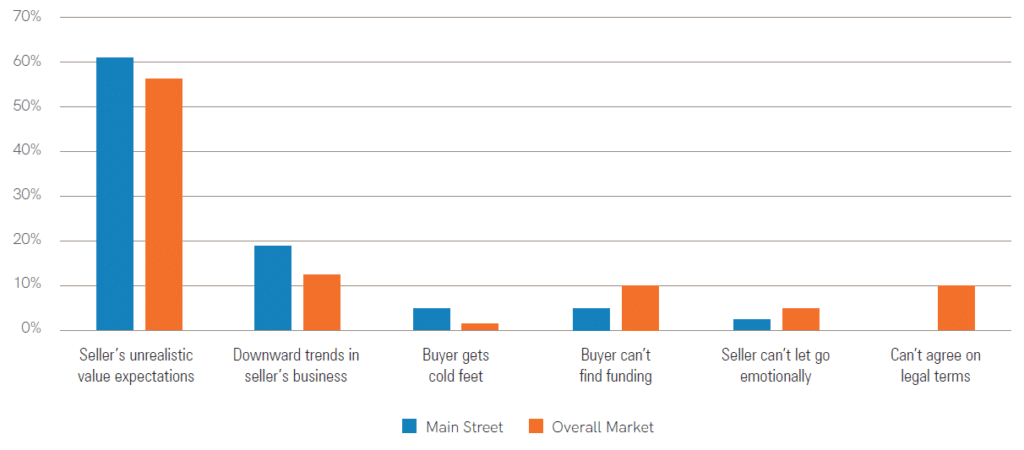
According to Lisa Riley of LINK Business Phoenix: “Sometimes we run into problems when other advisors make unrealistic promises or agree to take a business to market knowing the seller’s target price is unrealistic. More often than not, the business lingers on the market, the seller’s energy wanes, and business value starts to erode. Advisors who agree to shoot for the moon are really doing their clients a disservice in the end.” We couldn’t agree more with this sentiment. Beware when the advisor that is helping you understand your company’s value does not actually sell businesses. These advisors do not talk to buyers or lenders with any frequency and they have no pulse for the current marketplace.
Deal Structure
Relative to the past decade, the amount of cash that sellers are receiving at closing is strong.
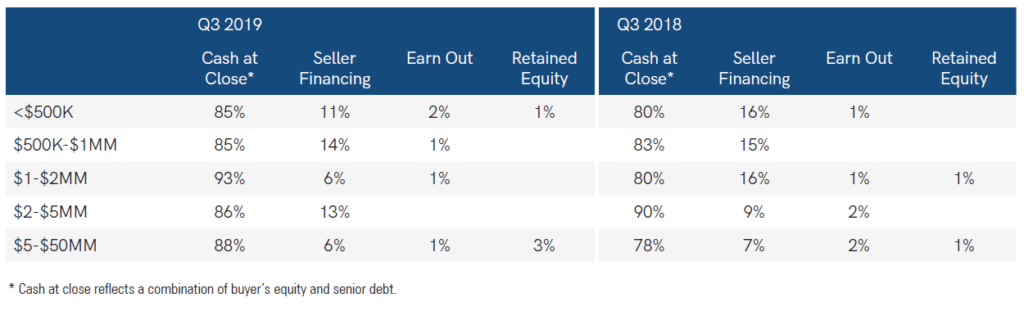
While cash at closing remains historically strong, keep in mind that seller financing is usually part of every transaction. Sellers are typically carrying 10-15% in some form or the other. “Lenders always like to see sellers keep some skin in the game,” said Justin Sandridge of Murphy Business Sales- Baltimore East. “When sellers aren’t willing to finance any of the purchase price that sends warning signals to buyers and lenders alike. Refusing to provide seller financing is like holding up a giant ‘no confidence’ sign and it’s likely to scare other parties away from the deal.”
To assist with the terms, cash at closing refers to the combination of buyer cash and senior debt (bank loan) that the seller receives the day that the business sells. Cash at closing is very important to sellers because it carries no risk to the seller going forward.
While it is not defined by the IBBA, “Seller Financing” likely refers to a seller note. A seller note is an amount that is owed to the seller by the buyer. Generally, that amount is paid off over time and carries interest. The buyer is required to pay any seller note although it will almost always be subordinated to the bank meaning that if the buyer does not pay it, the bank remains in 1st position in case of a buyer default (don’t worry! This is rare).
Earn out refers to contingent monies that the buyer will pay to the seller based on the future performance of the business. While it is most commonly tied to revenue, earn outs can also be tied to virtually any metric – gross profit, EBITDA, etc. Sellers generally do not like earn-outs because they feel post-sale that they have little influence over the success of the new owner. Despite this, earn outs can successfully bridge valuation gaps between buyers and sellers. It is important to note that transactions financed with SBA 7(a) loans cannot utilize earn-outs or any form of contingent payment.
Retained equity refers to a percentage of the business that the seller retains. For various reasons, buyers and sellers may want the seller to continue to have skin in the game. The buyer can view this as a sign of confidence and sometimes the seller wishes to sell but not fully exit the business.
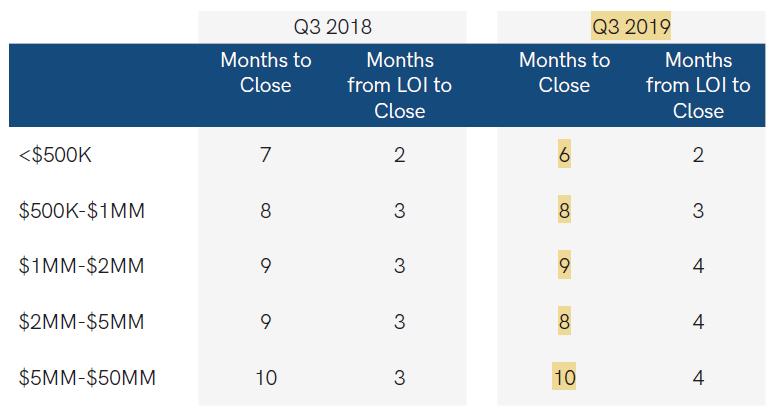
Time to Close
Unfortunately, when sellers make a decision to sell, they usually want it done yesterday. Sellers are often surprised to learn that, on average, it takes 8.2 months to close on the sale. Here are the metrics by the size of business:
“What affects timing?” you might ask. Great question. For the smallest transactions, a number of factors affect the relatively fast speed that they can get accomplished:
For Transactions <$500K
Limited or No Bank Financing Needed: It is fairly common that for a company that sells for $200,000, the buyer and seller might just work it out amongst themselves with a mix of buyer cash at closing and a seller note.
SBA Express Loan: SBA Express loans are often used for business acquisitions where the total amount needed is no more than $350,000. These loans feature fast turnaround time, often much faster than 7a.
Simplified Due Diligence: Quite frankly, a business that sells for $300,000 is generally not going to be as complex as a $5,000,000 transaction. The business model is generally simpler, there are fewer employees and overall there is just less paperwork and recordkeeping for a buyer to dig through. Due diligence can be completed in a week. This can speed up the whole process.
Reluctance to use Advisors: While we do not advise this, practically we see sellers and buyers of very small businesses avoid the expense of hiring advisors like CPAs or attorneys to assist in the sale process. This is not recommended but it can speed up the process.
For Transactions $1 to $5MM
Standard Bank Financing: It is very common for buyers to utilize a standard SBA 7(a) loan to acquire a business in the $1-5MM range. The maximum loan amount is $5MM and buyers like SBA loans due to the limited amount of cash equity that they need to bring to the transaction. SBA 7(a) loans require more paperwork, approvals, and appraisals, which can take 2-3 months to get through.
More Due Diligence: Businesses in this range start to become more complex, often with longer histories, more employees, more records and more sophistication in processes and products. Due diligence times may easily extend from 1-2 weeks to 30 days.
Importance of Advisors: We always advise and generally see buyers and sellers relying heavily on CPAs and transaction attorneys to help them wade through the complexities of asset allocations and purchase documents, etc, respectively. We are huge advocates of using professional advisors to ensure that things are handled properly. The use of additional advisors will generally add time to the process, particularly on the legal side, where it’s common to have a purchase agreement (with extensive exhibits and schedules), employment agreement, non-compete agreement, real estate lease or purchase agreement and a seller note agreement at the least, and these documents may go through multiple revisions.
Where Are Values Trending?
As indicated above, valuations for companies between $5-50MM in transaction value have been increasing. The same cannot be said unfortunately for smaller transactions, especially very small main street transactions <$500K.
Regarding smaller deals, according to 53% of business brokers surveyed, enough people have been talking and predicting a recession that it is starting to negatively affect valuation. Uncertainty around the presidential election and trade war is causing caution. “The market doesn’t like uncertainty, ” said Craig Everett, PhD, professor of the Pepperdine Private Capital Markets Project. “Nervous energy means buyers are dialing back a bit – particularly on the smaller market deals.”
Conversely, businesses with values of $5MM+ came in well above expectations in Q3. In fact, they came in at 109% of expectation. “While this sector typically comes in at or close to benchmark, it’s unusual to see results nine percentage points above target,” noted Jeff Snell, principal of Enlign Advisors.
Types of Buyers by Size
As is typical, the plurality of buyers for businesses <$500K-$5MM are first-time buyers, from 43-47%. Their chief motivation is buying a job (32-48%). This is noteworthy and owners should pay attention. I state this because most owners initially believe that existing businesses/strategic buyers will be the buyer. This is understandable considering they do not realize the breadth of the individual buyer pool, nor do they understand that most strategic existing companies either have no interest in acquisitions, or have no interest in paying a premium, preferring to acquire only when they can buy a company for a bargain. In fact, existing companies make up only 20-28% of buyers for businesses <$500K-2MM.
Existing companies jump to 41% of buyers for companies $2-5MM and 44% for companies $5-50MM. As expected, in the $5-50MM range first-time buyers drop off and private equity buyers become a significant buyer (44%).
Lastly, it is important to note that the vast majority of buyers for companies <$5MM (70-85%) come from less than 100 miles away.
In Summary
In closing, the main themes of this report remain consistent with those of the past year: sentiment continues to shift slowly away from sellers of companies valued less than $5MM, and especially so for the smallest main street companies valued at <$500K. This sentiment shift has been driven by fears of a recession, the political environment, and the persistent trade war. Although not discussed in this report in depth, we believe that bank financing is getting slowly more difficult to obtain for smaller deals. On the surface, banks remain eager to fund deals but underwriters are becoming more strict.
Valuation multiples remain steady and are increasing for the largest transactions. Cash at closing remains very strong. Individual and private equity buyers remain eager to buy companies.
For companies with valuations above $500K, it remains a good time to sell. We anticipate that this will be the case, especially for transactions $5MM+, for the longer-term.
About The Author – Max Friar
Max Friar is the Founder and Managing Partner of Small Business Deal Advisors, LLC and Calder Capital, LLC. Max began his tenure in mergers and acquisitions in 2005. His love of the industry is underpinned by an entrepreneurial drive and an enjoyment of being a student of success. Max has been a lifelong resident of Grand Rapids, Michigan.
About Small Business Deal Advisors, LLC
Small Business Deal Advisors, LLC, represents sellers of small businesses (typically valued up to $1 million) including franchise re-sale opportunities. Our sister company, Calder Capital represents sellers of manufacturing, service and distribution companies with enterprise value of $1-100MM.
Calder Capital is pleased to have sourced and closed ACG/Mibiz.com’s 2018 Deal of the Year <$25MM. Additionally, we are humbled that Max Friar was awarded Dealmaker of the Year Finalist 2018. Additionally, Calder received the distinction of #1 area M&A Firm by number of closed transactions for 2019.