As we entered 2020, all indicators pointed to another active year in the business-for-sale market. Despite US-China tariffs dominating headlines, the health of the small business sector hit all-time highs in 2019. A combination of record financial performance, available and affordable financing, and retiring Baby Boomers created a robust mix of supply and demand. The result was a third straight year of a historically strong main street M&A market.
This trend continued for the first two months of the year, with small business transactions in line year-over-year according to BizBuySell’s Q1 Insight Report, a nationally-recognized economic indicator which aggregates statistics from business-for-sale transactions reported by participating business brokers nationwide. Then, COVID-19 began rapidly spreading in the U.S. causing shutdowns across the country. The stock market crashed and panic about the financial climate and national economy spiked.
Since the initial shock, the federal government approved several relief acts aimed at helping support small business. Perhaps the most significant for the business-for-sale market is the Small Business Administration Debt Relief Program. Under the program, the SBA will pay (not defer!) the first six principal and interest payments on behalf of the borrower for SBA 7a loans. All existing 7a loans and new 7a loans closing between March 27th and September 27th, 2020 are eligible for this historic program. Factor in historically low interest rates and acquisition costs are markedly lower than even 3 months ago.
According to business brokers representing small businesses valued at less than $2 million, 46% of their deals have been delayed and another 11% cancelled due to COVID-19. 36% said their deals remained unaffected, while 7% said they represented a business that had increased in value due to the outbreak.
Most business owners also believe business will be back to normal within 7 to 9 months, according to BizBuySell’s survey, with the highest percentage of respondents expecting a recovery in 4 to 6 months. Owners are encouraged by the actions of the federal government that will help small businesses navigate uncharted territory. 55% of respondents believe the federal government is doing a “good” to “very good” job. Another 23% said “average”, with the remaining indicating “poor” to “very poor” at 13% and 9%, respectively.
While most of the first quarter was business as usual, we expect to get a better view of the impact as data continues to be released. If you are interested in having a one-on-one discussion regarding your business and current business-for-sale environment, please contact us.
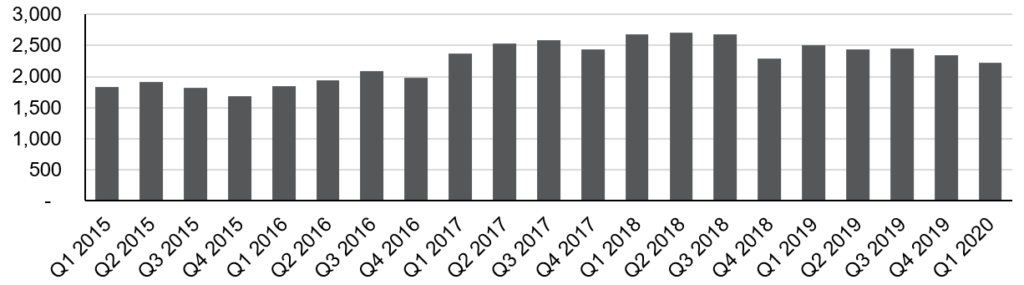
Closed Main Street & Lower Middle Market Business Transactions
The number of closed transactions in Q1 2020, as reported on Bizbuysell.com, for main street and lower middle-market companies dropped 5% to 2,225 vs Q4 2019.
While transactions were down compared to last year, the financial performance of sold businesses remained strong. The $600,000 median revenue is just shy of the record-setting $601,380 generated in 2Q19. Median cash flow followed suit, also up 11% to $129,548, and again just short of the 2Q19 figure of $130,000. These historically high financials help to illustrate the strong trajectory the small business market was on prior to the pandemic.
Median Sale Multiples
The median sales multiples have remained fairly consistent over time for main street businesses.
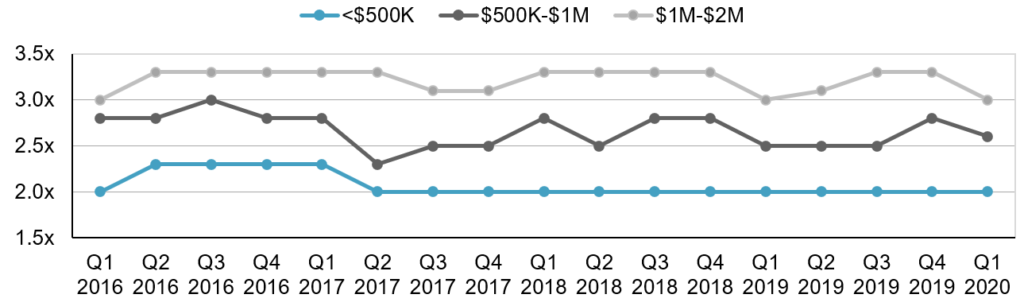
As of Q1 2020, the median SDE multiples based on transaction size as reported in IBBA’s Q1 Market Pulse were:
<$500K: 2x SDE
$500K-$1M: 2.6x SDE
$1M-$2M: 3x SDE
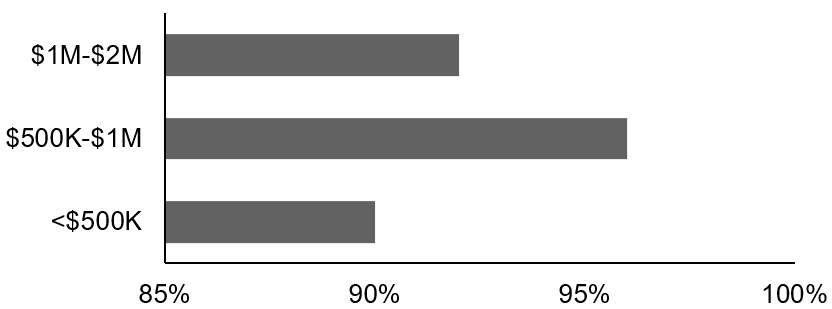
Selling Price Versus Asking Price
In Q1 2020, final sale prices came in between 90% to 96% of the pre-set asking price or internal benchmark, on average.
According to Bizbuysell.com, the $250,000 median sale price of businesses sold in the first quarter was an 11% lift from Q1 of 2019, but fairly level with the three prior quarters and matching the median sale price for 2019 overall. The $286,000 median asking price in Q1 2020 was higher than the $275,000 asked for during 2019. It appears owners entered 2020 with a desire to cash out at higher values but buyers pushed back.
A challenge moving forward will be in assessing a fair business value considering many businesses will have little to no profit for the duration of government ordered shutdowns. Generally, business values are determined by cash flow over a 2 to 3-year period. Despite the pandemic, it is only natural for owners to desire prices based on their long-term track record, rather than a weeks-long anomaly.
Buyers, on the other hand, may want to negotiate based on perceived future risk. With fewer customers, revenue and cash flow are reduced which reduces business value. To bridge the gap, both parties will need to consider creative ways to provide value and mitigate risk.
Deal Structure
Year-over-year trends for cash at close and seller financing are relatively consistent. The chart below details, by transaction size, the amount of cash at closing, seller financing and earnout portions of deals.
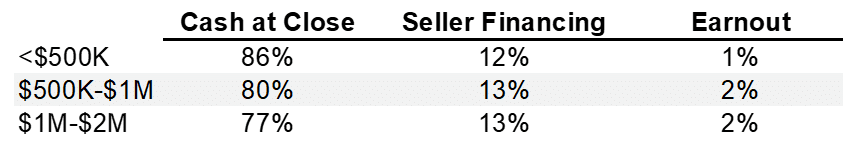
We will likely see increased use of seller financing and earnouts to bridge valuation gaps in the months ahead. Buyers may ask for earnouts as a way to reduce risk and banks will likely require more equity from sellers/buyers, to which seller notes can contribute.
Our assumption is that Q2 stats will reflect less cash at close. For Main Street deals that use SBA funding, earnouts are not an option, so we will likely see larger seller notes. For deals that do not involve SBA funding, we expect increased use of earnouts.
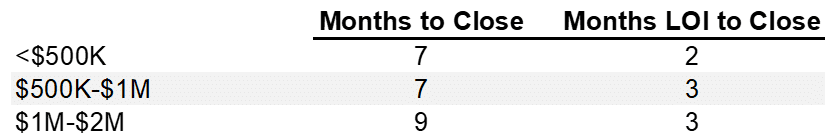
Time to Close
The average length of time to sell a small business is shown below (as of Q4 2019).
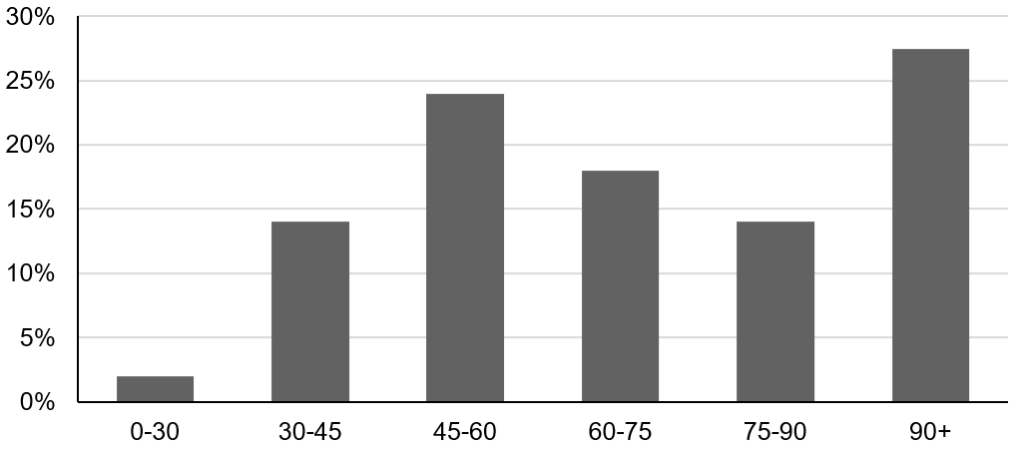
However, due to the COVID-19 pandemic, most advisors expect delays. Shown below is the estimated length of delay (in days) that advisors expect for deals under $2 million. Over 25% of advisors expect the extra time to close deals could exceed 90 days.
Top Selling Sectors
In the Main Street market, restaurants led the smallest transitions while personal services were trending throughout the sector.
- <$500K
- Restaurants (27%)
- Personal Services (22%)
- Consumer Goods (15%)
- $500K to $1M
- Healthcare (19%)
- Consumer Goods/Retail (19%)
- Personal Services (15%)
- $1M to $2M
- Construction/Engineering (20%)
- Personal Services (17%)
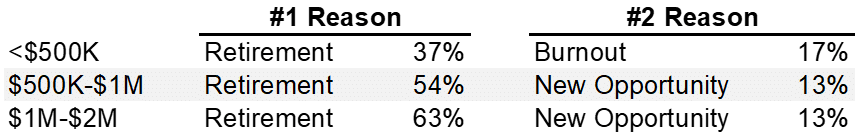
Reason for Sale
Retirement is the number one reason for small business sales.